Is industry really classifying and labelling hazardous mixtures incorrectly 44% of the time?
You may have seen ECHA’s newsletter on 17th December 2019, with the worrying headline “44% of hazardous mixtures are not compliant with classification and labelling obligations” (see here).
You can imagine consumers going about thinking that its unsafe to use nearly half of their household chemicals, although luckily this piece of information has not hit the mainstream media, at least in the UK.
I’m a big fan of the saying, that there are “lies, damned lies, and statistics”, attributed to Disraeli, and like to dig deeper behind the headlines to find what’s really going on, .
If this statistic of “44% non compliance” covers the entire chemical and chemical-using industry in the EU, then it really would be alarming. But it doesn’t tie in with my experience, nor I suspect most peoples’ experiences, even when considering imported materials from non-EU countries.
So what is going on? is it really as bad as the headline makes out?
The CLP part of the research report was based on ECHA asking Competent Authorities to carry out inspections on companies with varying roles in the supply chain, across 28 EEA countries (including Norway). There was a compulsory section on mixture classification and labelling, and SDSs, then four voluntary modules on small packages, harmonised classifications of CMRs, laundry liquitab compliance, and biocidal product regulation compliance.
My first thought is to question what they mean by “non-compliance”, because there are so many rules on labels and Safety Data Sheets, that it’s easy to have a technical infringement which doesn’t really affect the meaning of the label, or potentially cause someone to misinterpret or misunderstand the hazards.
In the real world, the most important thing is whether or not somebody could be harmed by the lack of information, or incorrect information.
A look at the underlying report, https://echa.europa.eu/documents/10162/13577/ref-6_project_report_en.pdf/bfa9fc69-fdfd-2f52-bf96-5174d7e29cf8 (a mere 62 pages) gives more detail.
It turns out that “17 % of the reported mixtures had incorrect classification which may also lead to incorrect labelling.“. This seems reasonable, because incorrect classification can cause harm to the end user. However, what the report fails to do is state how the classification is incorrect.
As you probably already know, the CLP classification is based on the GHS classification, which comprises the hazard class, and the hazard category, for example Skin Irrit. 2, is hazard class Skin Irritant, and hazard category level 2.
This classification terminology can be confusing for native or fluent English speakers, because “class” and “category” are used interchangeably.
The way that I think about it is that the hazard class is the type, or sort, of hazard, and the hazard category is the level, or degree of hazard. It would be really helpful if GHS and CLP could change the name from hazard category to hazard level, but I’m not going to hold my breath.
It would also be helpful if ECHA were to adopt the GHS’s sub-categories for acute toxicity, that is oral, dermal and inhal. (for inhalation), as technically you can have e.g. Acute Tox. 3, which can apply to any of the three sub-categories. This is why some people (me included) always put the Hazard Code after a classification, to ensure that the full information is available to everyone reading an SDS. But again, I’m not going to hold my breath waiting for the regulators.
With my nerd hat on, there are several possible permutations of classifications:
- correct hazard class, correct hazard category
- correct hazard class, higher level hazard category
- incorrect hazard class, applied unnecessarily
- correct hazard class, lower level hazard category
- incorrect hazard class, omitted from label
Obviously “correct hazard class and correct hazard category” is a correct classification.
Technically “correct hazard class, higher level hazard category”, and “incorrect hazard class, applied unnecessarily” are incorrect classifications, but in practical terms, it’s unlikely that anybody is going to be adversely affected by this. It just means they will take extra precautions which are not required.
The last two classifications are ones which are incorrect, and which may lead to people being harmed because either a hazard is not identified when it should be, or it is assigned a lower level hazard category than it should have.
Unfortunately ECHA’s questionnaire (helpfully provided at the end of the research report) did not ask what type of incorrect classification had been made, so we can’t tell from the overall 17% statistic whether these incorrect classifications might lead to harm or not.
There is some extra information, which is that “For 9 % of those substances checked in the project, the required harmonised classification and labelling were not applied.”
Now, you may think that this would automatically mean that an incorrect classification, but this is not necessarily the case, because:
- Harmonised Classifications are partial classifications, which means that not every hazard is included in the Harmonised Classification itself (except pesticides and biocides, which cover every hazard class). These extra hazards need to be found from another source, e.g. the REACH dossier. And it’s not clear whether adding in additional hazards would count as non-compliance
- Also, checking Harmonised Classifications was not part of the compulsory part of the research, and was only carried out by 8 countries in a total of 81 inspections out of 1620, that is in only 5% of all inspections
To complicate matters further, later in the report this is reported:
“In 2483 (93 %), the classification of the substances with a harmonised classification in the mixture in Section 3.2.1 of the SDS(s) corresponded to the harmonised classification in Annex VI Table 3 in CLP, while in 188 (7 %) it did not correspond.“
So Harmonised Classifications were also checked as part of the main study, but the compliance rate is 7%, rather than 9%. And, again, the questionnaire is ambiguous on whether extra hazards over and above the Harmonised Classification would be considered a non-compliance.
Then we have the little matter of whether the sample size checked is representative of hazardous mixtures in the EU. There are several things to consider:
- what the overall number of hazardous mixtures checked were, compared to the number of hazardous mixtures on the EU marketplace
- whether the number of mixtures checked in each country is proportionate to the size of their chemical industry
On the first point, I have not been able to find a number for the hazardous mixtures which may be available on the EU marketplace, but I would think that there must be several million, at least. The total number of mixtures checked is 3,391, which if there were a million hazardous mixtures would give a percentage check of 0.34%, and I suspect the real percentage checked is much lower. In QC terms, the sample size is probably not big enough, and targeting was allowed in the methodology, rather than random sampling.
For the second point, the comparative size of the chemical industry in EU member countries can be estimated from CEFIC’s report “Landscape of the Chemical Industry 2020”, download here, which is based on 2018 turnover figures.
Taking the turnover in Euros of each country’s chemical industry from this report, and comparing it to the number of inspections carried out shows whether or not the inspections have been proportionate to the size of the industry in each EU member state.
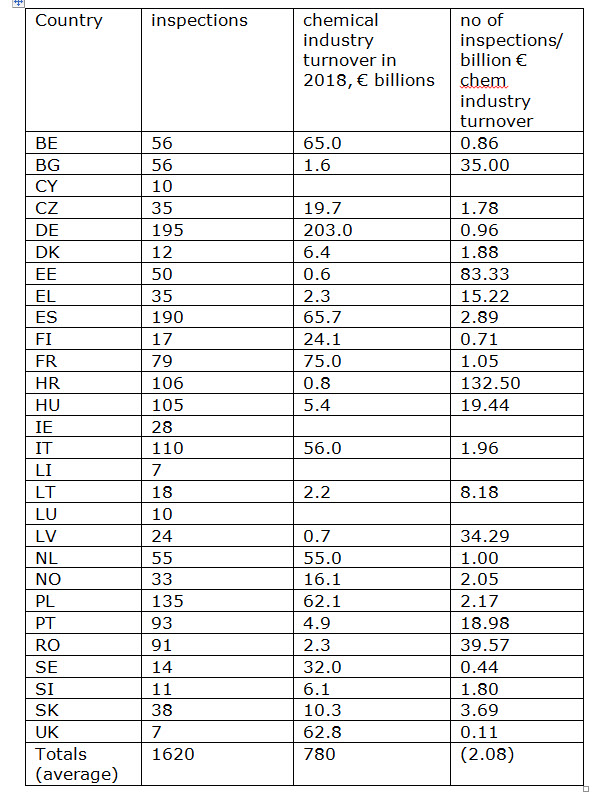
As can be seen from the table above, the average number of inspections per billion euros turnover of the chemical sector was around 2, yet the highest inspection rate was Croatia (HR) with 132, and the lowest the UK, with 0.11 . Given the comparative sizes of the chemical sector by turnover, Croatia being 0,8 billion and the UK 62.8 billion, it can be seen that this sampling methodology skews the results in favour of the smaller turnover countries. (Chemical industry turnover data was unavailable for certain countries, including Ireland, as well as the very small countries like Lichtenstein, Luxembourg and Cyprus).
This means that the countries which have a smaller chemical industry, and therefore have less chemical expertise, both in the sector and in their regulators, may be dominating the results, and as these countries would be expected to have higher rates of non-compliance, can we really believe that the findings are truly representative?
This is further complicated by the fact that targeting was allowed, rather than random sampling. If you are Competent Authority wanting to show off to ECHA, are you going to do a random visit, or target someone who you suspect may be non-compliant?
Another area of concern is in the labelling non-compliance figures. This is best shown in a graph from the report itself:
As you can see, there are 12 errors or deficiencies, but only 6 of these could lead to harm coming to the end user, that is Product identifier, signal word, hazard pictogram, P statements and H statements.
To be fair to ECHA, they do explain that most of the errors which could lead to harm to people are likely to come from incorrect classification, and I agree strongly with their findings that
“Manufacturers, importers and downstream users have to put more effort into deriving the right classification for mixtures and communicating it down the supply chain. This will prevent incorrect information being disseminated in safety data sheets and on labels.”
However, this important message is at risk of being lost in all the “hype” about massive numbers of incorrect hazardous mixture classifications and labels, which as we’ve seen may not really be justified.
It is frustrating that ECHA appear to be going for a “hyped-up” headline on a sample that is not particularly representative of the industry throughout the EU as a whole, and which does not differentiate between non-conformances which could cause harm, or those which breach legislation but do not affect user safety.
A cynic might suggest that their approach may be related to the fact that they are currently renegotiating how they are funded, so it is in their short-term interests to publicise statistics which appear to show that their services are going to be required for some time.
But my concern is that a poorly-designed statistical report does not do ECHA any favours with us, the chemical industry, in the long term. ECHA expect us to provide accurate information in our REACH dossiers and C&L notifications, as well as on our labels and SDSs, and surely we should expect them to do the same with the work they carry out.
The cherry-picking of statistics also reflects badly on their judgement, at a time when the European Commission and ECHA are trying to impose a Harmonised Classification for Titanium Dioxide on the chemical industry which is simply not supported by the evidence.
It’s all rather worrying, but I hope that we, as individuals responsible for classification, labelling and safety data sheets can continue to focus on making sure our classifications are as accurate as possible, and that our labels and SDSs match our classifications, because keeping the users of chemicals safe is what is truly important.
GHS Classification Courses from TT Environmental Ltd
17th February 2020
Like this article? You’ll love our free guide to CLP (and you’ll also get our articles delivered direct to your inbox every week!)